Send data from RudderStack to Avo Inspector
Use Avo Inspector as a RudderStack destination
If you are already sending your data to RudderStack you can stream it to Avo Inspector without adding any code to your codebase.
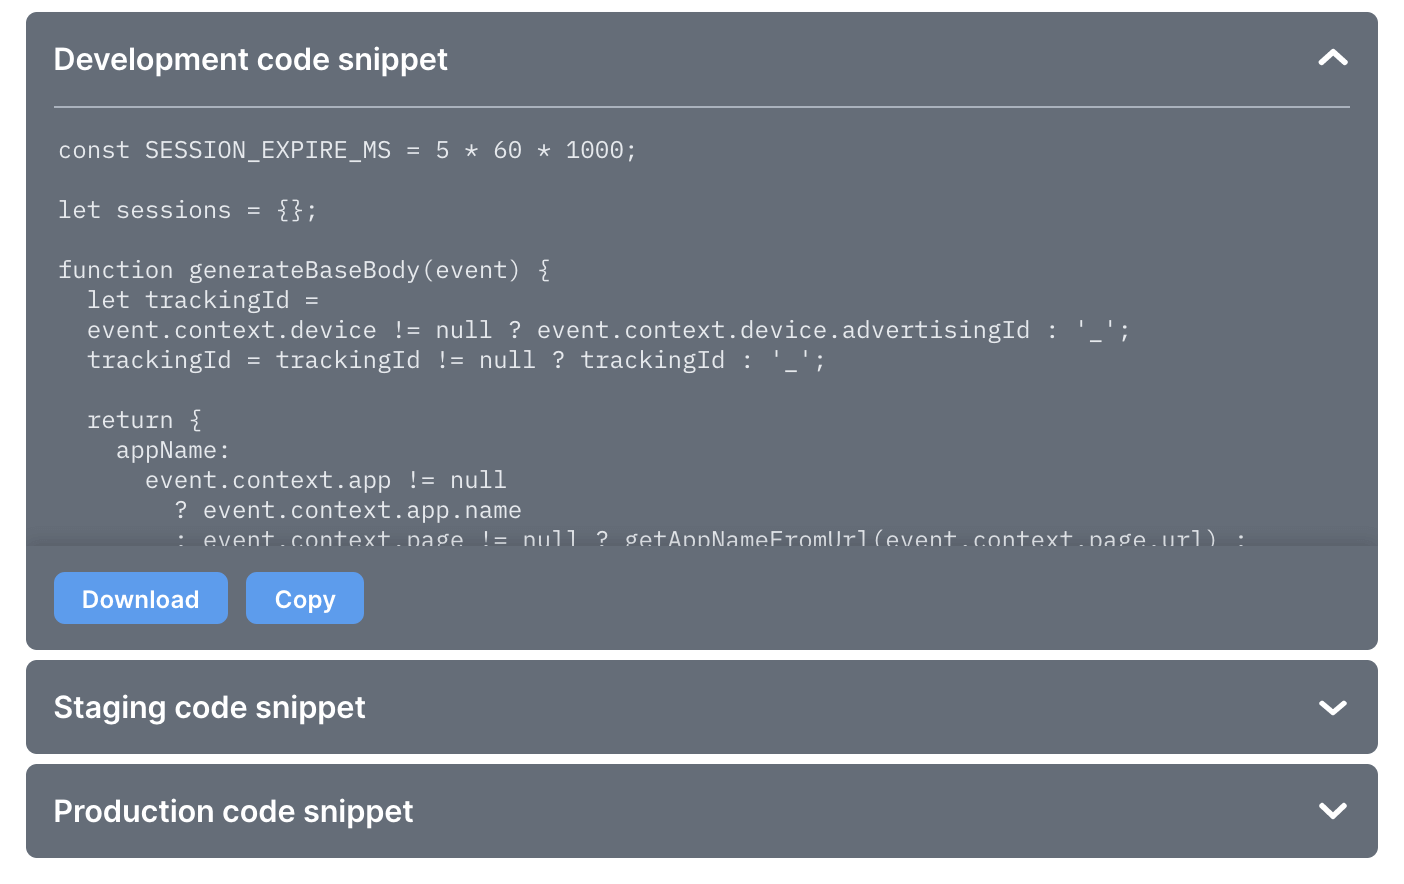
You’ll need to create a RudderStack Destination powered by RudderStack Transformation with a code snippet provided in your Avo workspace for each app and environment combination.
The Transformations that we will add here are not changing the events you receive from RudderStack in any way. They add a side effect of Avo Inspector analyzing your events and keeping your RudderStack events stream unchanged.
In RudderStack you usually have different sources for each app environment, for example if you have a single web app, you probably have Web App Dev and Web App Production sources in RudderStack.
Unlike RudderStack, Avo sources contain environments in them, so you will only need to create one Avo source per app, in our example you’ll need a single Avo source called Web App.
After connecting a Transformation to corresponding RudderStack source the event schemas of all events seen in RudderStack will automatically be sent to Avo Inspector and you’ll be able to monitor the quality of your tracking implementation without any changes in your code!
Inspector only receives your event schema, no actual data will be sent to Avo.
Remember that production data takes up to 2 hours to appear in Inspector dashboard, while development data is available without any delay.
Guide to connect RudderStack and Avo Inspector
Create an Avo source to get the code snippets for your RudderStack integration
Step 1. Set up your Avo source
An Avo Source is the first thing you need to connect your RudderStack data to Avo Inspector.
Open Sources in the Avo sidebar or Manage Sources in Inspector tab
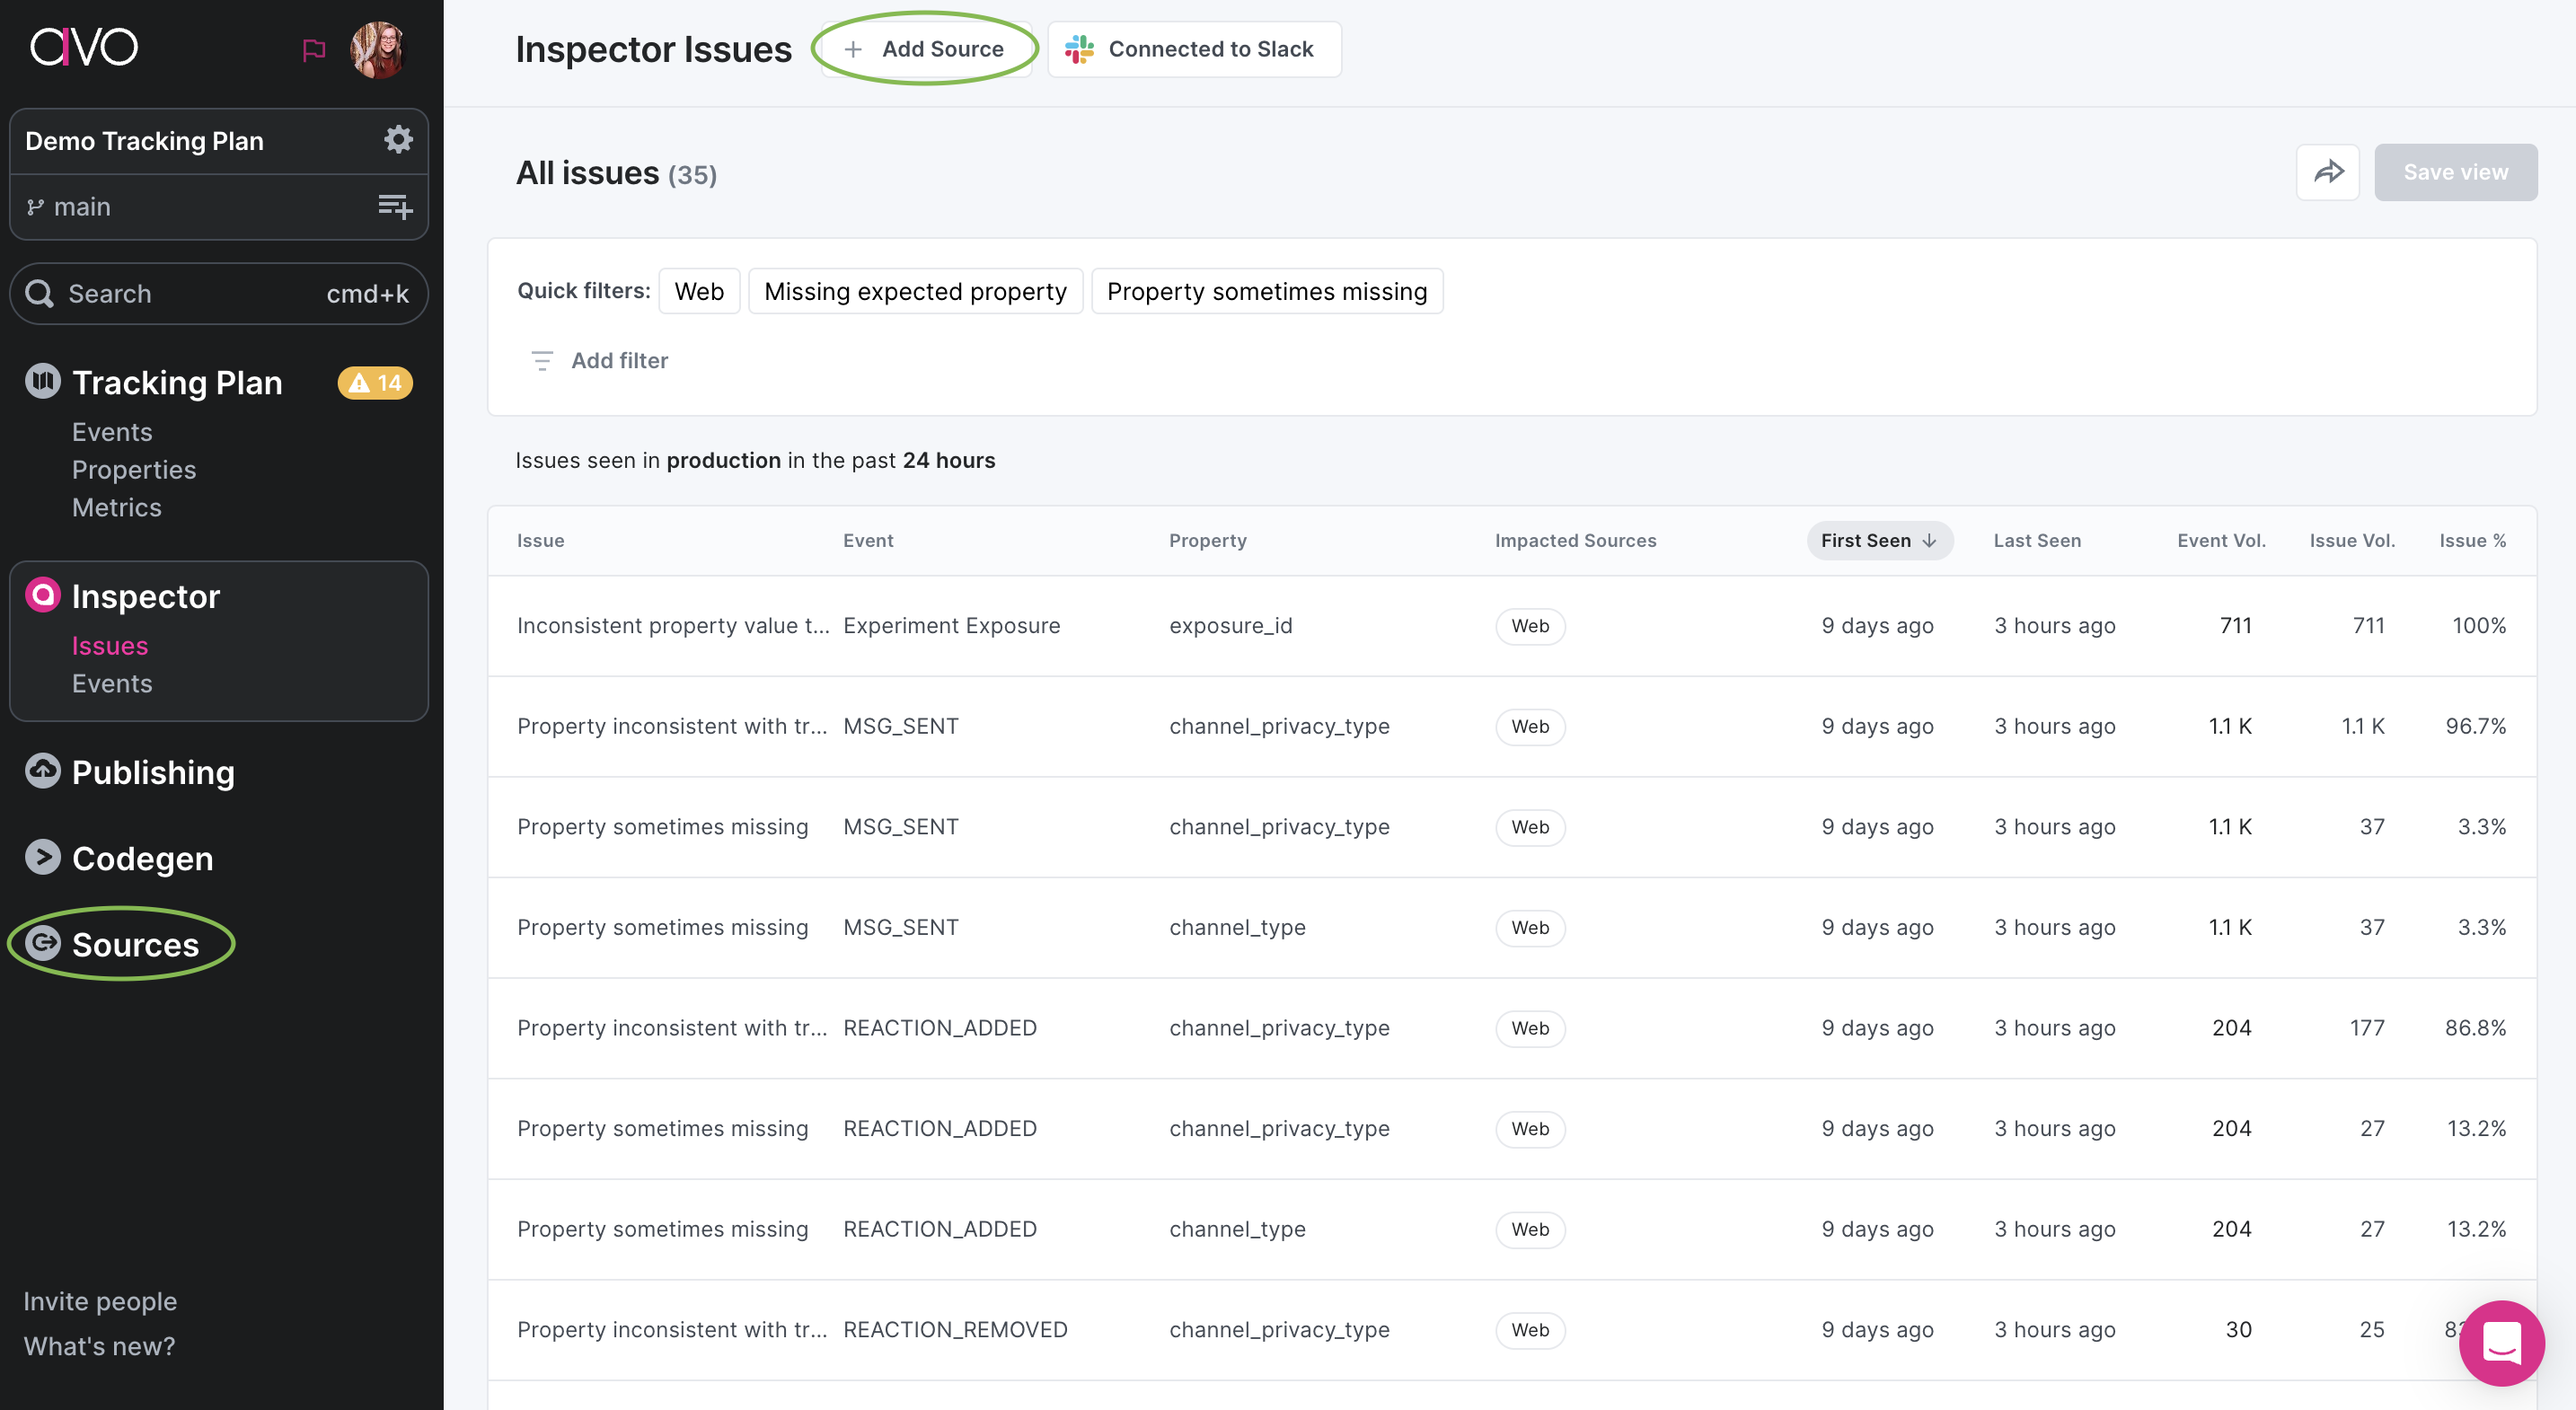
If you already have the source, pick it. If you don’t have the source corresponding to your app, add a new one.

In the source details, go to “Inspector Setup” and there you’ll see options to integrate Inspector. Pick RudderStack to see the integration code snippets.
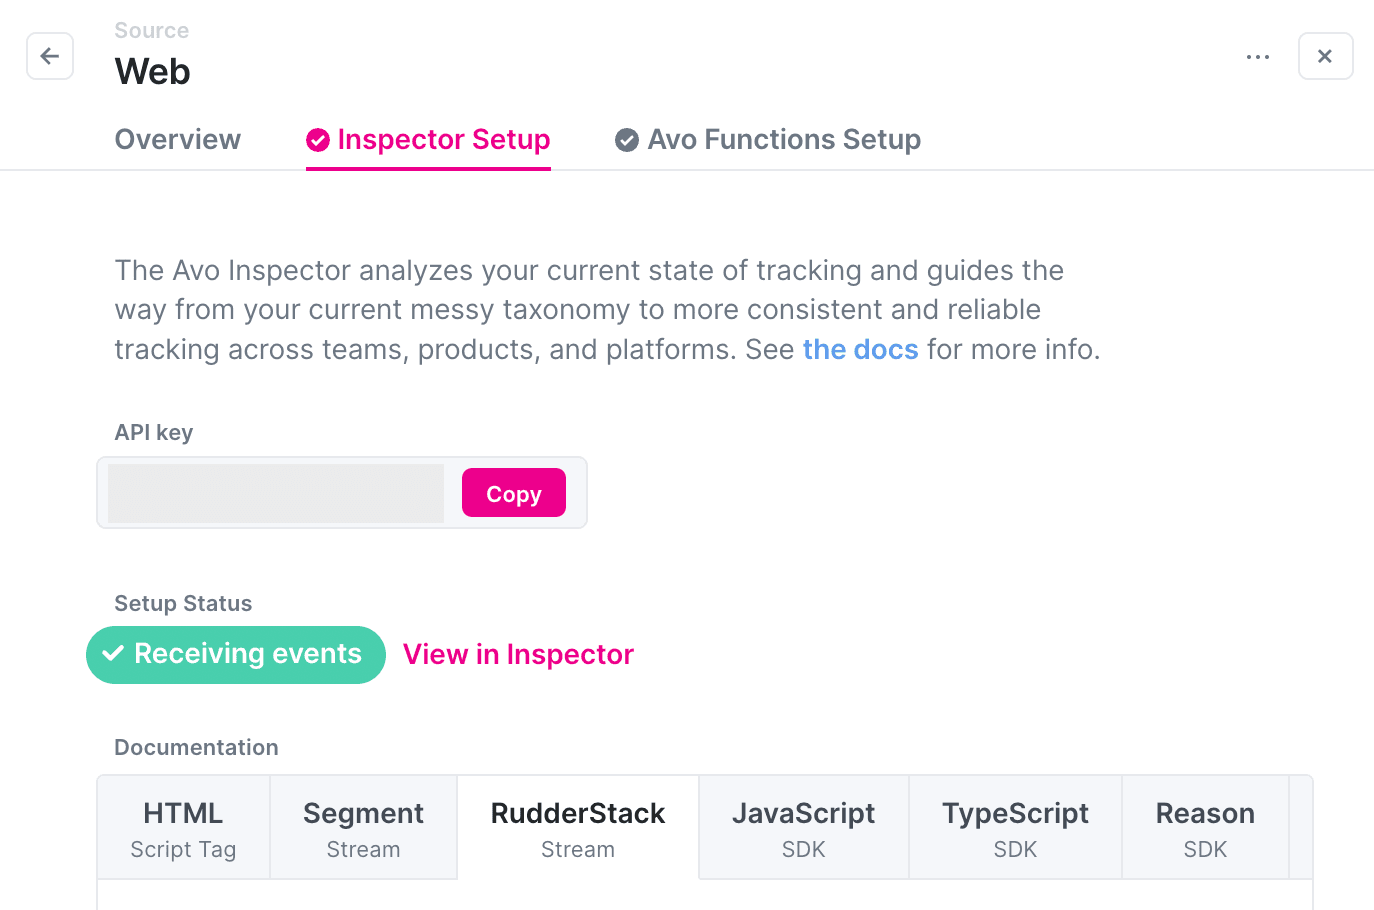
Use the copy button to copy the full snippet to clipboard when you need to paste them into RudderStack on the next step.
Step 2. Create RudderStack transformation with the provided code snippets
-
Open RudderStack and log in into your workspace
-
Pick
Transformationsin the sidebar -
Press the
New Transformationbutton in the top right corner
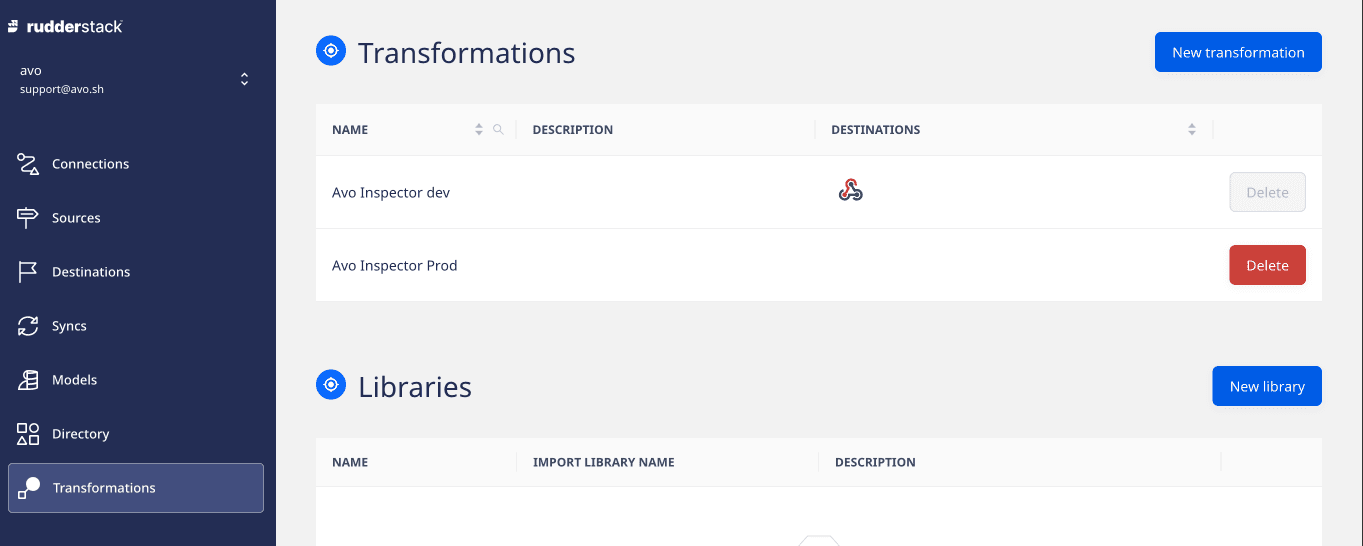
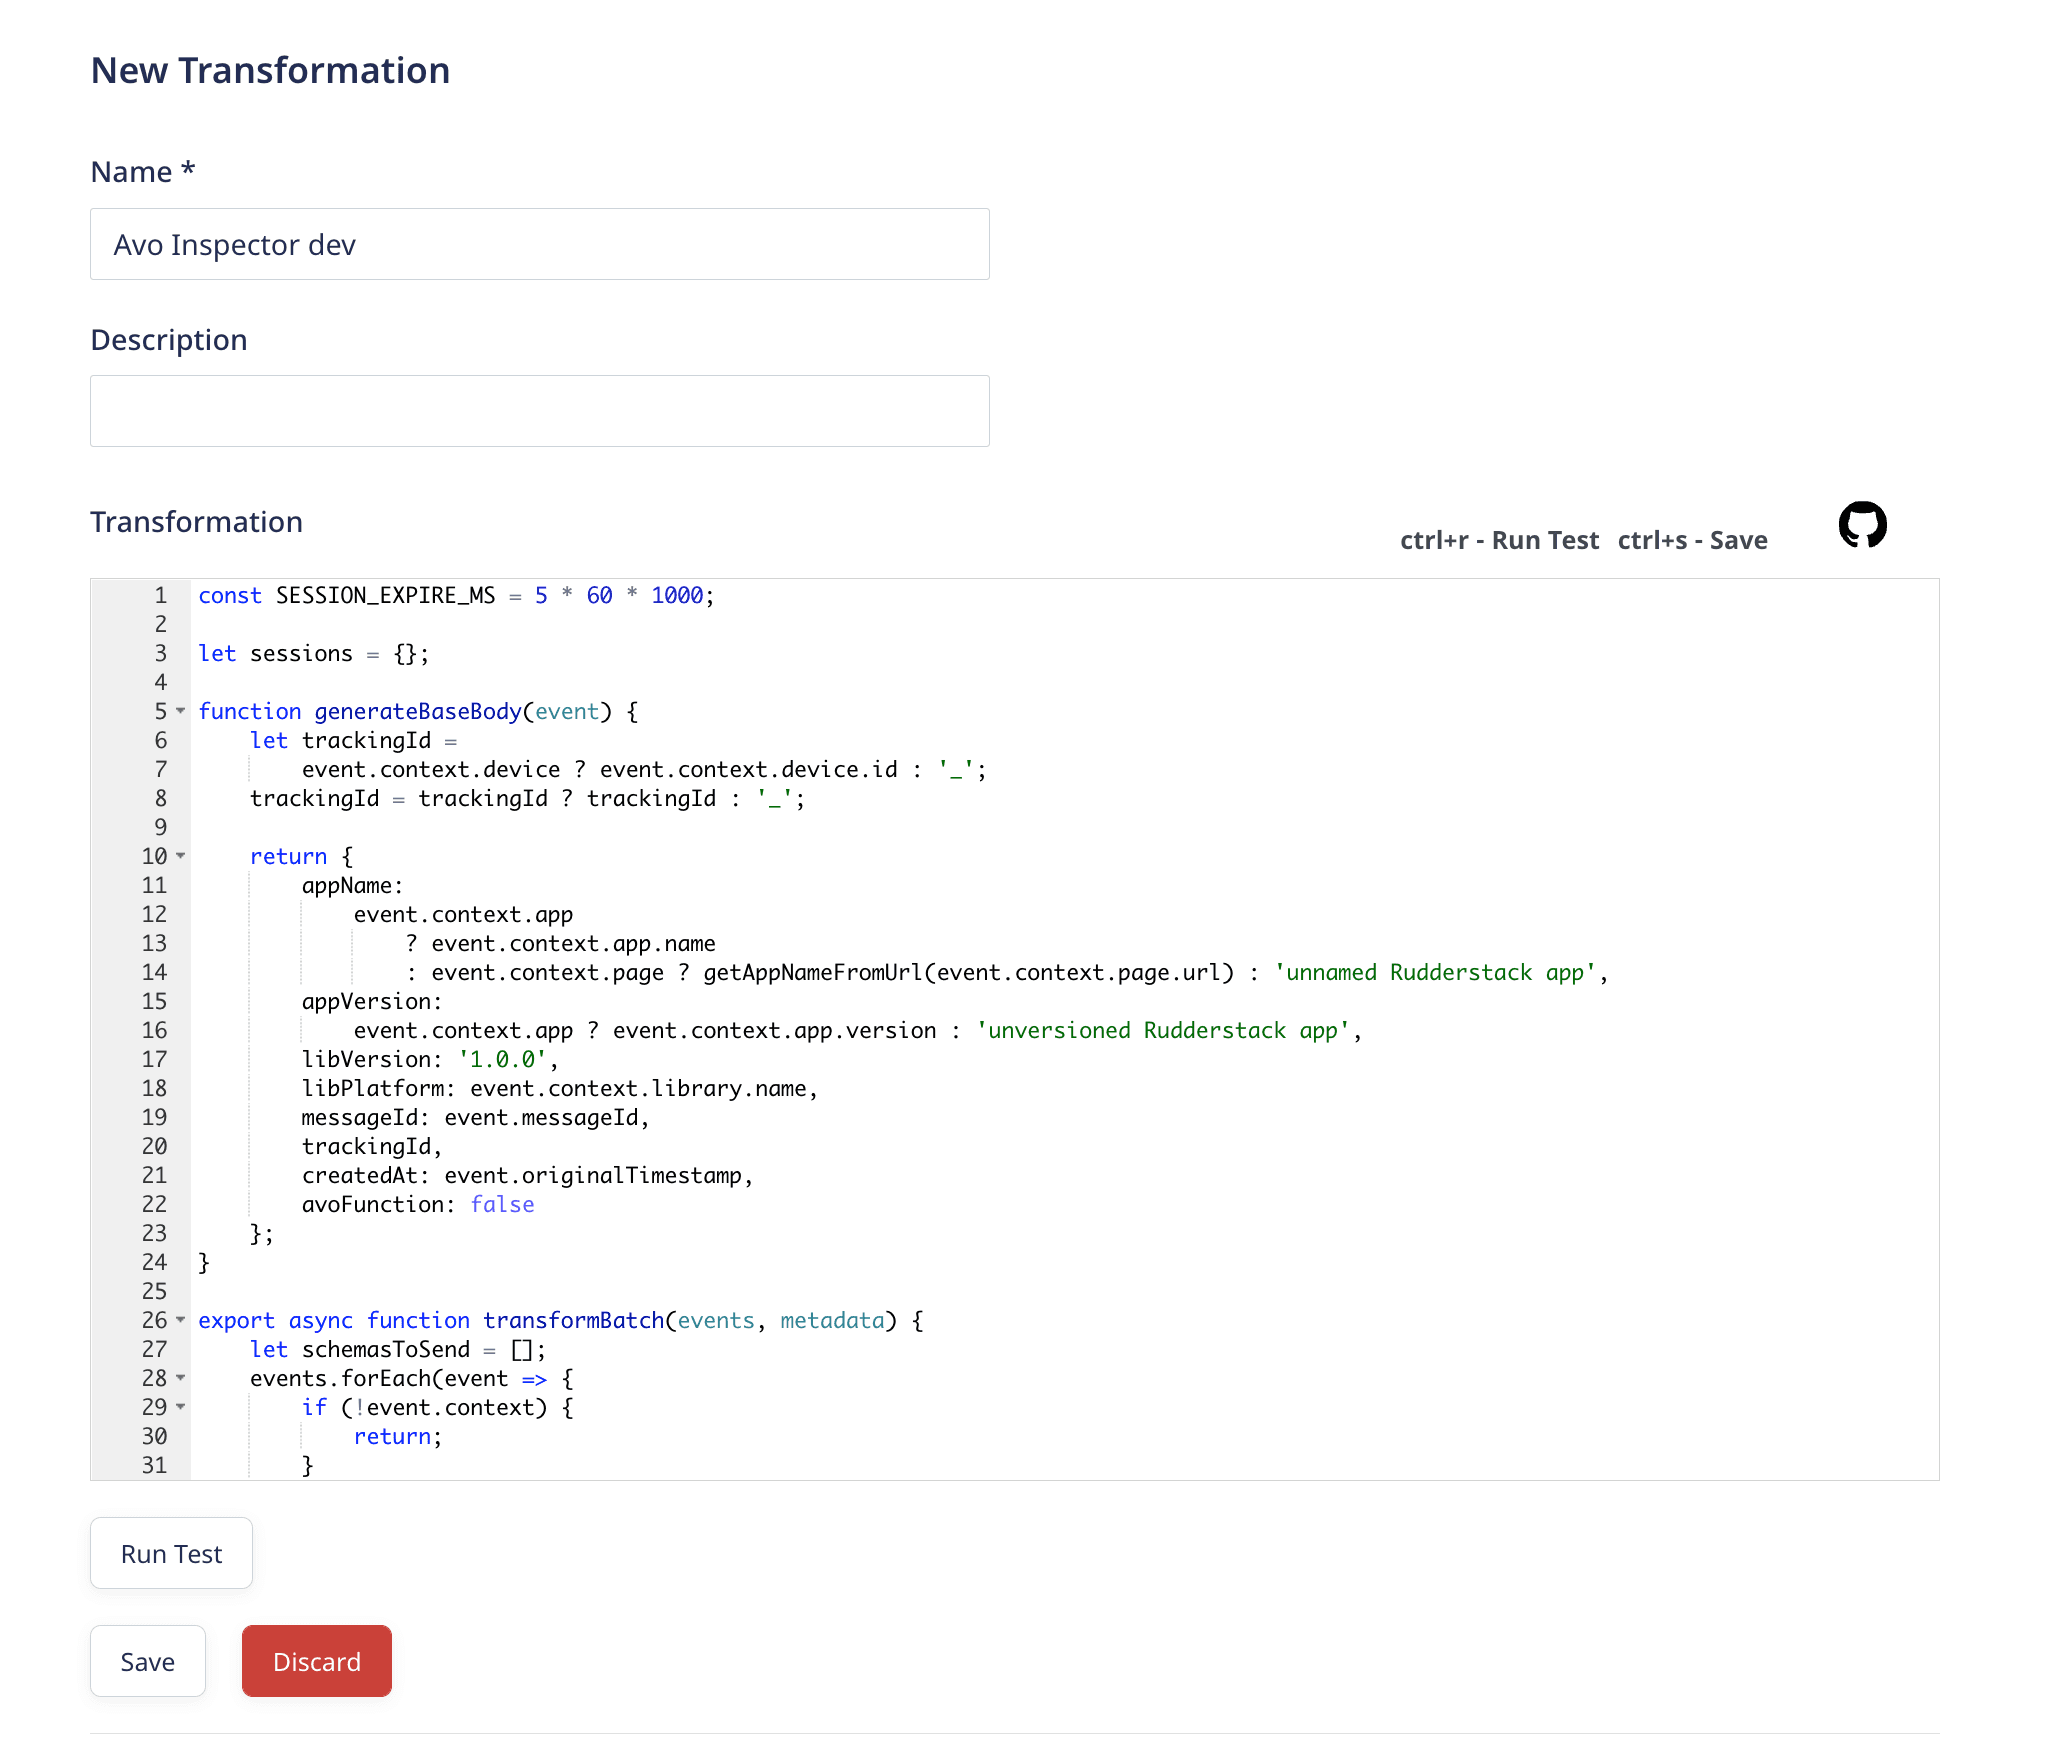
You’ll find yourself in the web code editor provided by RudderStack. Here you would paste one of the code snippets we’ve seen in Avo on the 1st step.
You’ll need to create a separate Transformation for each code snippet, i.e. one for development, one for staging and one for production per each Avo source.
Save it by pressing Save button under the code editor.
Step 3. Test your development RudderStack Transformation (Optional)
You can test the production RudderStack Transformation in the same way, but keep in mind that the production data shows with a ~2 hours delay in Inspector dashboard, while development data is shown without delay.
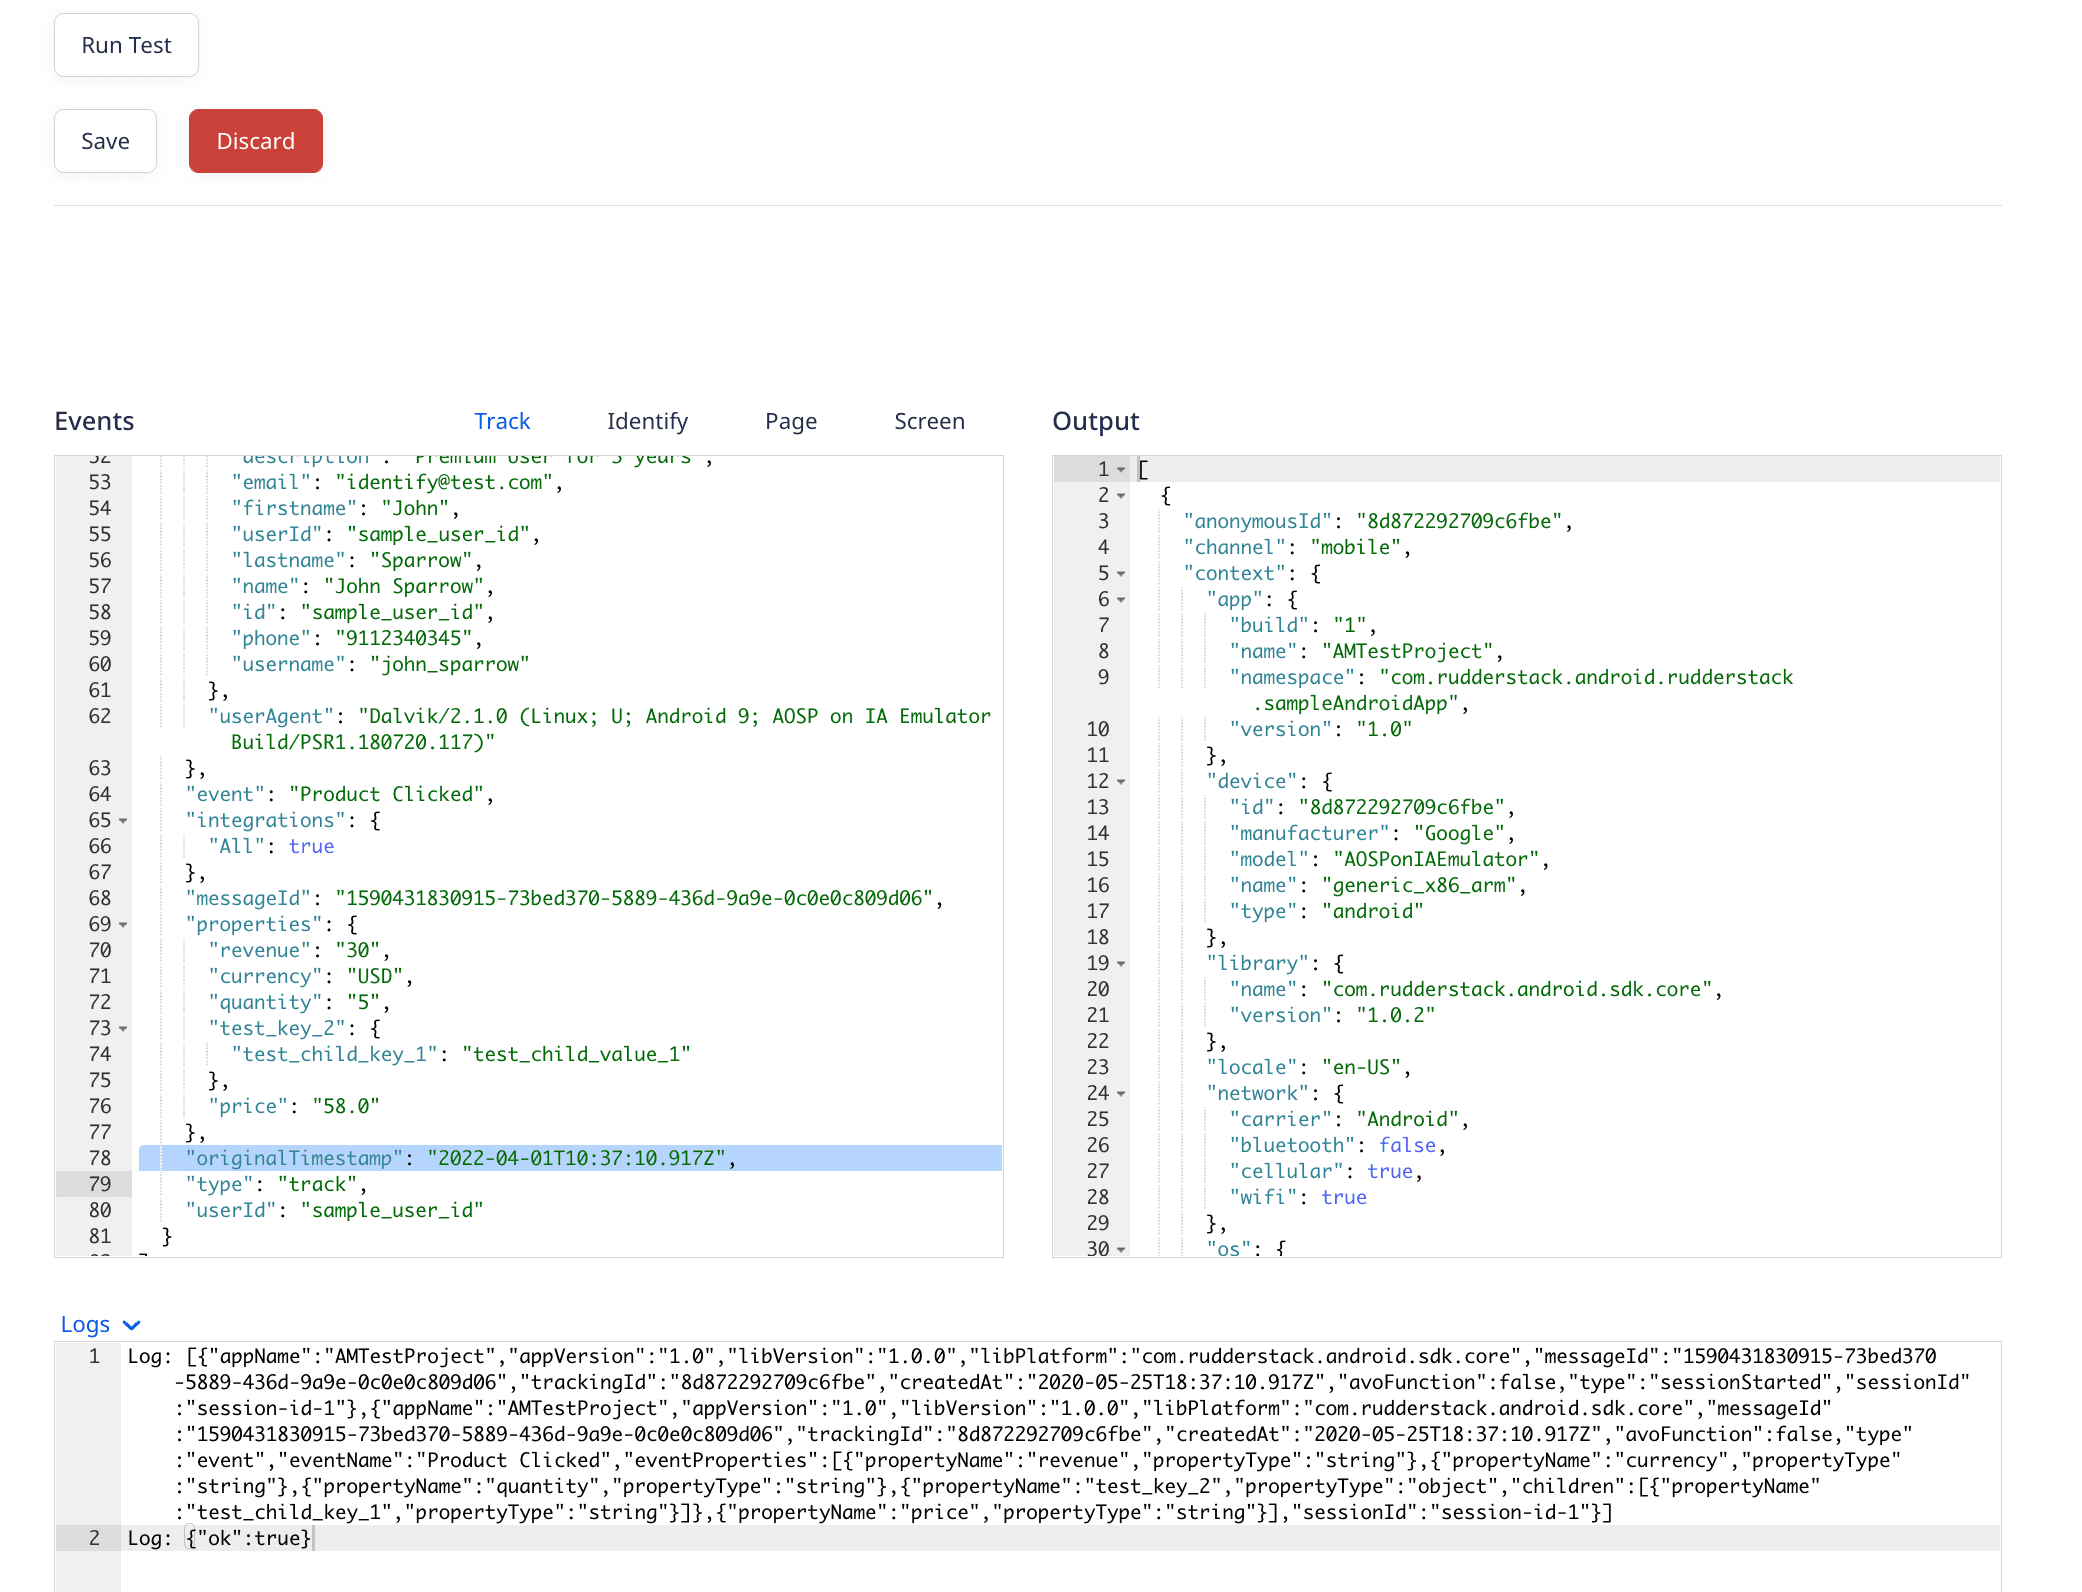
If you pick the Track event in the Events code editor in the bottom of the page and then press “Run Test” button, the event will be sent to Avo Inspector
To see the event in Avo you will need to fix the event originalTimestamp to a recent timestamp.
For example change this old timestamp provided by RudderStack (line highlighted on the screenshot below)
"originalTimestamp": "2020-05-25T18:37:10.917Z",
to current ISO timestamp, which you can find on this website
Press the Run Test button.
Check out the Logs, it should say Log: {"ok":true} in the end.
Then navigate to Avo, pick Inspector in the sidebar and pick Development environment

You’ll see the event in your dashboard under the source from where you got the snippet from.
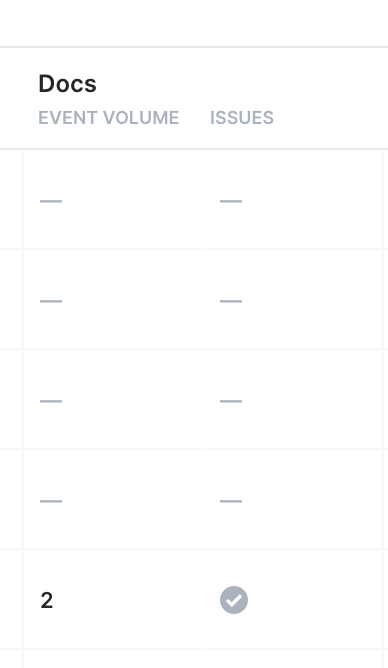
This means that the RudderStack Transformation is working.
Step 4. Connect the RudderStack Transformation to your RudderStack Destinations
To properly route the data to Avo Inspector you’ll need to create a destination per each app environment and then connect corresponding Inspector Transformation to the destination.
For example, you are have a web app with production and development environments and send the data to Mixpanel.
In this case you’ll need to create two Mixpanel destinations in RudderStack - one for the production app and another one for the development app. Mixpanel settings will be identical in both.
Connect the Transformation created with the development Inspector snippet to the development Mixpanel destination and the production Inspector Transformation to the production Mixpanel destination.
To make the connection pick Destinations in the sidebar, pick one destination and go to Transformations tab.
There you can pick a Transformation that will be ran on every event that is sent to this destination.
On this screenshot we connected the development Avo Inspector transformation to the Development Destination.

Then go to the Sources tab and make sure that the destination is connected to the correct source.

Now your RudderStack events stream from this source to this destination is analyzed by Avo Inspector.
Error response from API
The calls to the API are fire and forget, so the API tries to return 200 if it can.
The API will accept multiple events in a batch, and returns a 200 with {"ok": true} if all the events managed to get processed.
If any of the events were invalid or if the API failed to decode them, it will return a 200 response, with
{"ok": false, "errors": [{"message": <Error message>, "json": <jsonString>}]} which contains the Json for each event that failed.